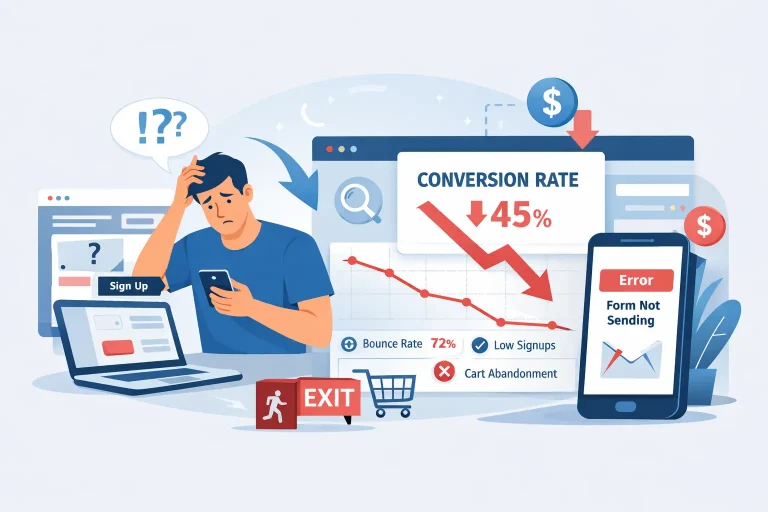
Google Analytics: Key Metrics to Monitor for Business Success

In today’s digital landscape, data is the cornerstone of success. It’s not enough to simply have a website—you need to understand how visitors interact with it, what’s working, and what needs improvement. Google Analytics provides this critical insight, offering a wealth of data that helps businesses make informed decisions. However, with numerous metrics available, it can be overwhelming to know where to focus. 

This article breaks down the key metrics you should monitor in Google Analytics to track performance, understand user behavior, and optimize your website for growth. 

1. Users and Sessions
Understanding Your Audience

One of the first things you’ll want to know is how many people are visiting your website. The Users metric shows the total number of unique visitors, while Sessions refers to the number of individual visits made to your site, even if a single user visits multiple times. Monitoring these numbers helps you gauge your overall website traffic and understand how many people are engaging with your content.  

Why it matters: A consistent increase in users and sessions indicates that your website is attracting new visitors and retaining existing ones. If these numbers decrease, it may be time to revisit your marketing or SEO strategies. 

2. Bounce Rate
Keeping Visitors Engaged

The bounce rate indicates the percentage of visitors who exit your site after only viewing one page without taking any action. A high bounce rate could mean that visitors are unable to find what they are looking for or that the user experience requires enhancement.  

Why it matters: If you have a high bounce rate, it could indicate that you need to improve your content, design, or loading speed to encourage visitors to stay longer and explore more. On the other hand, a lower bounce rate generally indicates that users find your website engaging and exploring multiple pages. 

3. Average Session Duration
Measuring Engagement Time

The Average Session Duration metric indicates the average amount of time users spend on your website during a single visit. This metric helps you understand how compelling your content is and whether visitors are spending adequate time to complete important actions, like reading a blog post, watching a video, or filling out a form. 

Why it matters: Longer session durations indicate that users value your content and are more likely to convert. If visitors leave too quickly, you may need to adjust your content to be more engaging. 

4. Pages Per Session

Depth of Engagement

The Pages Per Session metric represents the average number of pages a user looks at during a single session on your website. This metric is a good way to assess how engaging your site is and whether visitors are exploring more of your content after arriving on your site.  

Why it matters: If users view a high number of pages per session on your website, it usually means they are interested in your content and willing to explore more. If this number is low, you should consider adding more internal links or related content to keep visitors engaged and encourage them to explore your site further.

5. Traffic Sources

Where Are Visitors Coming From?

Traffic sources show how users discover your website. Google Analytics categorizes traffic into organic search, direct traffic, referral, social, and paid search. Knowing which channels bring the most traffic can guide your marketing strategy. 

Organic traffic: These are visitors who come to your website from search engines like Google or Bing. 

Direct traffic: These are visitors who type your website’s URL directly into their browser. 

Referral traffic: These are visitors who arrive from other websites that have linked to your site. 

Social traffic: These are visitors who come from social media platforms like Facebook, Twitter, or LinkedIn. 

Paid search: These are visitors who come to your website through paid ad campaigns, such as Google Ads. 

Why it matters: Understanding the sources of your traffic helps you concentrate on the most productive channels. For instance, if organic search results are disappointing, you may need to improve your SEO strategy. On the other hand, if social media traffic is strong, it may be beneficial to allocate more resources to social media campaigns.

6. Goal Completions and Conversion Rate

Tracking Success of Key Actions

In Google Analytics, goals enable you to monitor particular user actions like form submissions, newsletter signups, or purchases. The Goal completion metric indicates the number of times users finished these actions, while the Conversion Rate displays the percentage of users who completed a goal out of the total number of visitors. 

Why it matters: Monitoring goals and conversions helps you measure the success of your website’s primary objectives. Whether you’re driving sales, generating leads, or building an email list, tracking these metrics shows how well your site is performing in these areas. 

7. Exit Pages

Understanding Where Users Drop Off

The Exit Pages report displays the pages that users are on when they leave your website. While it’s common for users to exit after finding the information they need, a high exit rate on key pages could indicate a problem. 

Why it matters: If important pages, such as checkout or contact forms, have high exit rates, there may be an issue with the user experience. Analyzing these pages can help you identify areas that need improvement to reduce drop-offs and improve conversions. 

8. Device Breakdown

Analyzing Mobile vs. Desktop Traffic

The Devices report gives you information about the types of devices visitors use to access your site, such as desktops, mobile phones, or tablets. As mobile traffic continues to grow, it’s important to make sure your website is optimized for all devices. 

Why it matters: If a significant portion of your website traffic is from mobile devices, but you’re noticing low engagement levels on mobile, it may indicate that your website is not optimized for mobile usage. This information is important for prioritizing mobile optimization to improve the user experience across all devices.

9. New vs. Returning Visitors

Building Loyalty and Attracting New Users

Google Analytics enables you to track the ratio of new visitors to returning visitors. New visitors are discovering your website for the first time while returning visitors are those who come back after a previous visit. 

Why it matters: A good balance between new and returning visitors indicates that you are attracting new users and retaining your audience’s interest. If there are significantly more new visitors than returning ones, consider improving engagement strategies to promote repeat visits.

10. Site Speed

Optimizing for Fast Performance

Site speed is an important metric in today’s fast-paced digital environment. Slow loading times can harm user experience, increase bounce rates, and hurt your SEO rankings. Google Analytics provides insights into your website’s loading speeds and identifies areas where improvements can be made. 

Why it matters: If your website takes too long to load, visitors are likelier to leave before exploring your content. Monitoring and optimizing site speed regularly can help create a smoother, more enjoyable experience for your users.

Conclusion

Google Analytics is a powerful tool for gaining insights into your website’s performance and making data-driven decisions. By monitoring key metrics such as Users, Bounce Rate, Average Session Duration, and Traffic Sources, you can gain a better understanding of how visitors interact with your site. This understanding can help you optimize their experience and ultimately drive growth. Whether your goal is to increase conversions, improve engagement, or boost traffic, keeping an eye on these metrics is essential for achieving long-term success. 

Table of content

Leave a Reply

Your email address will not be published. Required fields are marked *

Read Our Other Articles

Scroll to Top

CONTACT OUR
BUSINESS DEVELOPMENT EXPERT

Contact Form
Open chat
OneData Software Solutions
Hello!
How can we help you?